Nanopore Troubleshooting
“DNA concentration is one of the main factors which can affect quality of your Nanopore data. We recommend you use high specificity fluorometric concentration methods such as the Qubit range to QC your samples. Photometric concentration measurements such as Nanodrop can overestimate the DNA concentration, which may affect the read depth and analysis you receive.
Nanopore sequencing can read through a DNA strand without primers or the short read length limitations of Sanger sequencing. Nanopore sequencing should generally provide a more comprehensive assessment of whole construct structure than Sanger sequencing. Some loci are challenging to sequence using Nanopore methods so Sanger can be a good way to confirm a specific region. The main challenges for our Nanopore sequencing service are homopolymer repeats, low-complexity regions and reverse complemented elements. This may mean that some bases in a challenging region are reliable leading to low confidence base calling within these regions. These limitations are likely to improve with ongoing updates and research in protocols and base calling software.
Sample Requirements
For optimal results we recommend using a Qubit for DNA quantification, as it can distinguish dsDNA, even in extremely small amounts or in the presence of contaminants.
Nanopore Amplicon
15ul @30ng/μl per sample
Nanopore30
15ul @30ng/μl per sample
Nanopore150
30ul @30ng/μl per sample
Nanopore300
50ul @30ng/μl per sample
Rolling Circle Amplification (RCA)
A small volume of overnight culture (around 50 μl)
Plasmid Extraction
1ml of overnight culture
Colony PCR
150 µL of glycerol-free overnight culture or extracted genomic DNA
Data Interpretation Of A HTML Report
The table contains a list of your samples within the order, mean quality, assembled length and a completion status. This table will also list any errors which may have occurred if your sample has not successfully completed analysis.
When a reference has been submitted there will be an extra column called Expected Assembly which indicates if the sequence has matched to the data collected.
Examples of data results
Please note that these are interpretations of results and may not explain your data exactly, if you have further questions, please contact: sequencing.cambridge@sourcebioscience.com.
Good circular plasmid data (clear peak) on Nanopore 30
Raw Data
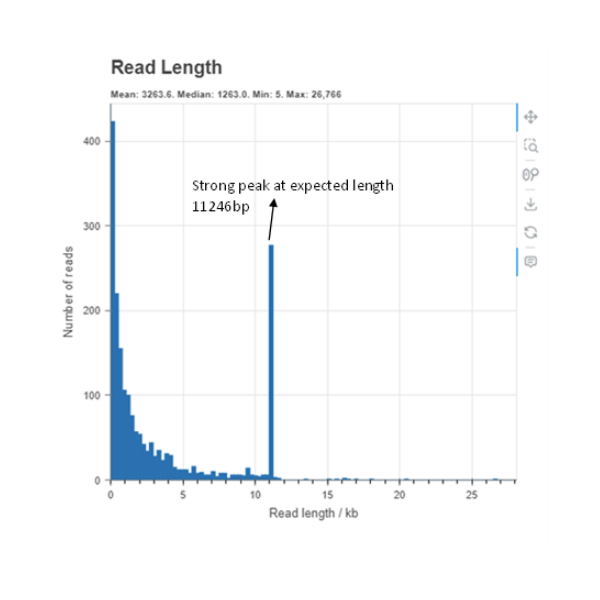
Downsampled
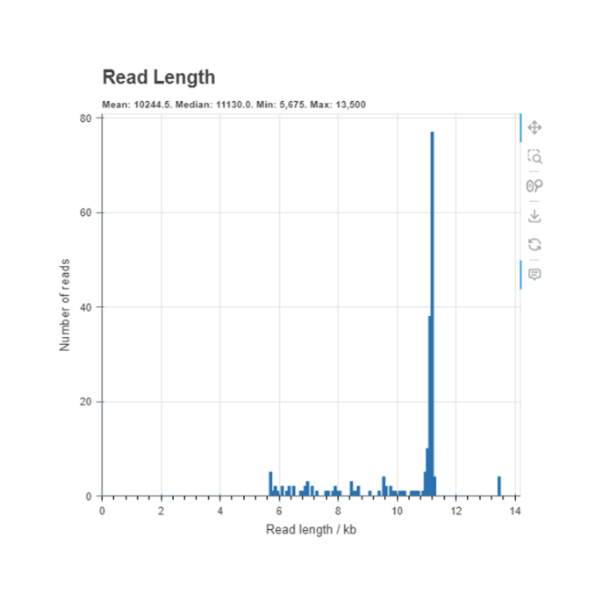
This Read length histogram shows an example of a good result showing a clear dominant peak at the length that was expected of this sample. The downsampled histogram shows the reads which have been trimmed and used in the assembly which you can see majority of the reads are at the expected size.
Please keep in mind that even a single dominant peak may contain multiple plasmids of the same read length with an inverted insert segment. Such a sample may fail to assemble as a consensus of the sequence is unable to be established.
Where SNP type variants are present in an input DNA sample this may result in poor quality base scores for this loci.
Unfortunately, we do not offer free repeats for our nanopore service, unless a technical issue has occurred on our end. If you believe you have submitted your sample at the correct concentrations, please contact sequencing.cambridge@sourcebioscience.com and we can further investigate this.
Good amplicon data


Linear dsDNA reads are not expected to have a read length peak at the construct size like circular DNA constructs. On the “Base yield” plot displayed above, the “elbow” point at about 6.5kb shows that most of the input DNA sample is below this size.
Multiple plasmids within a sample
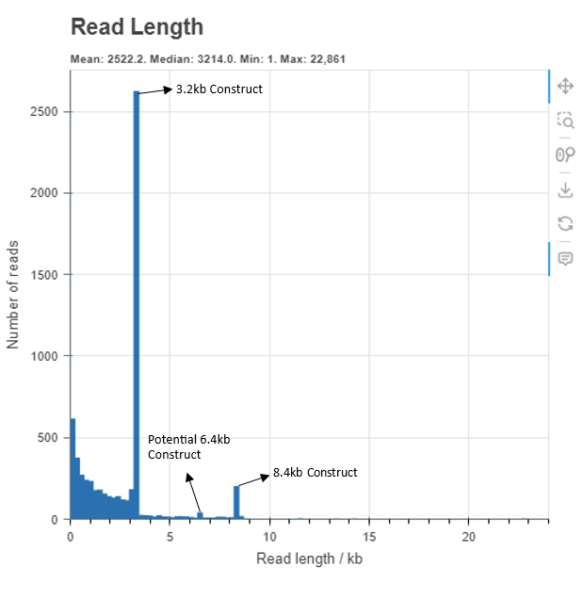
This read length plot shows a sample with multiple differently sized circular DNA constructs. These peaks happen because the DNA is prepared with a transposase that linearises the circular DNA enriching the dataset for full plasmid length reads.
There appears to be the largest peak at 3.2kb followed by potential constructs at 6.4kb and then an additional construct at the expected peak around 8.4kb. The expected size for this sample was around 8.4kb, however the analysis has assembled a 3.2kb plasmid due to majority of reads representing this construct.
Currently our nanopore service only supports a single consensus sequence. To be certain of your construct we would suggest size selecting your input DNA and re-submit to confirm.
Self-ligation plasmid
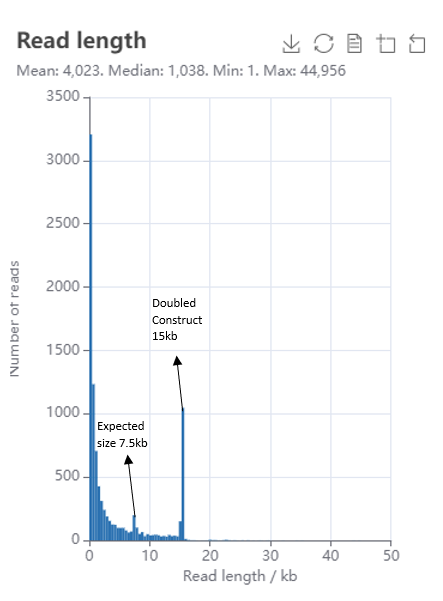
This read length histogram shows self-ligating copies of repetitive expected plasmid construct of 7.5kb. The self-ligated plasmid represents a doubled-up version of the expected construct where the full plasmid sequence is repeated within one circular DNA construct.
Low quality DNA

This is an example of a read length histogram of a failed to sequence at sufficient coverage. The DNA quality and concentration of this sample was very low and not at our recommendations. As you can see in the example above there is no curve or a clear dominant peak and poor read depth which is needed to complete an assembly. In cases of low concentration, we recommend using our RCA pre-treatment service as an optional enhancement. RCA is a highly efficient method that selectively amplifies circular DNA to produce clean, high-coverage input for nanopore sequencing.

This is an example of a sample which has good read depth read count but has no peak which indicates that the input DNA does not contain circular DNA constructs.
Contact us today and one of our skilled account managers will be in touch with a free consultation including further information and pricing details.